Wayfair (W) Just Flashed Golden Cross Signal: Do You Buy?
When a stock experiences a golden cross technical event, good things could be on the horizon. How should investors react?
From a technical perspective, Wayfair Inc. (W) is looking like an interesting pick, as it just reached a key level of support. W's 50-day simple moving average crossed above its 200-day simple moving average, which is known as a "golden cross" in the trading world.
There's a reason traders love a golden cross -- it's a technical chart pattern that can indicate a bullish breakout is on the horizon. This kind of crossover is formed when a stock's short-term moving average breaks above a longer-term moving average. Typically, a golden cross involves the 50-day and the 200-day moving averages, since bigger time periods tend to form stronger breakouts.
There are three stages to a golden cross. First, there must be a downtrend in a stock's price that eventually bottoms out. Then, the stock's shorter moving average crosses over its longer moving average, triggering a positive trend reversal. The third stage is when a stock continues the upward momentum to higher prices.
A golden cross contrasts with a death cross, another widely-followed chart pattern that suggests bearish momentum could be on the horizon.
Over the past four weeks, W has gained 19.6%. The company currently sits at a #3 (Hold) on the Zacks Rank, also indicating that the stock could be poised for a breakout.
The bullish case only gets stronger once investors take into account W's positive earnings outlook for the current quarter. There have been 4 upward revisions compared to none lower over the past 60 days, and the Zacks Consensus Estimate has moved up as well.
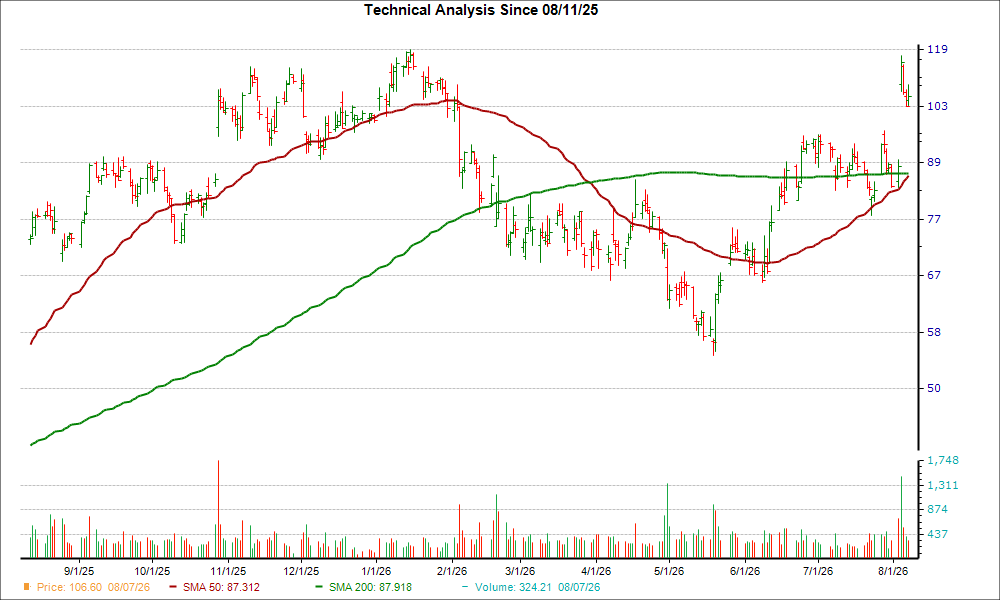
With a winning combination of earnings estimate revisions and hitting a key technical level, investors should keep their eye on W for more gains in the near future.
7 Best Stocks for the Next 30 Days
Just released: Experts distill 7 elite stocks from the current list of 220 Zacks Rank #1 Strong Buys. They deem these tickers "Most Likely for Early Price Pops."
Since 1988, the full list has beaten the market more than 2X over with an average gain of +23.9% per year. So be sure to give these hand picked 7 your immediate attention.
See them now >>Want the latest recommendations from Zacks Investment Research? Today, you can download 7 Best Stocks for the Next 30 Days. Click to get this free report
Wayfair Inc. (W): Free Stock Analysis Report
This article originally published on Zacks Investment Research (zacks.com).