Dave vs. dLocal: Which Fintech Stock Looks Better for Investors Now?
Dave and dLocal are profitable fintech growth stories, but their growth drivers, valuations and risk profiles differ sharply for investors now.
Dave Inc. DAVE and DLocal Limited DLO are both part of fintech, but they solve very different problems. Each uses technology to make financial services simpler, has been growing quickly, and is showing better operating leverage as scale increases. That gives investors two profitable growth stories rather than two early-stage companies still searching for a workable model.
The difference is where that growth comes from. Dave is a U.S. consumer neobank focused on cash-flow tools, especially ExtraCash, digital banking and newer credit products. dLocal is a payments infrastructure company that helps global merchants collect and send money across emerging markets. Dave therefore depends more on consumer engagement, underwriting and credit performance, while dLocal depends on payment volumes, merchant expansion and execution across many countries.
Both reported strong second-quarter 2026 results, but their risk profiles, growth drivers and paths to future earnings are not the same. That makes the comparison less about industry labels and more about business quality and durability.
The Case for DAVE
Dave’s second-quarter performance showed that its operating model is still gaining scale. Revenues rose 30% year over year to $170.8 million, while adjusted EBITDA increased 48% to $75.5 million. The adjusted EBITDA margin reached 44%, up from 39% a year earlier. Those figures suggest that revenue growth is translating into faster profit growth rather than being absorbed by costs.
Member trends were also solid. New members increased 32% to 951,000, monthly transacting members rose 17% to 3.08 million, and customer acquisition cost was $19. ExtraCash originations climbed 27% to $2.3 billion. Importantly, the 28-day past-due rate improved to 2.12%, showing that higher lending activity did not come with weaker reported credit performance.
Dave also has several potential growth levers. CashAI v6 is designed to support larger ExtraCash limits while managing losses, subscription revenues are expanding, and Dave Flex gives the company another way to deepen customer engagement. The Coastal Community Bank funding structure should also reduce Dave’s direct funding needs and improve capital efficiency as it scales.
Still, the model carries meaningful risks. Dave relies heavily on ExtraCash economics, consumer credit behavior and partner banks. A weaker labor market could put pressure on repayment rates, while regulatory and legal matters remain important considerations.
Management raised 2026 guidance to $725 million to $735 million of revenues and $315 million to $325 million of adjusted EBITDA. While the execution is strong, investors need to weigh that momentum against concentration in U.S. consumer credit and the need for newer products to prove themselves at scale.
The Case for DLO
dLocal’s second quarter reflected faster top-line momentum than Dave’s. Total payment volume surged 92% year over year to $17.7 billion, while revenues increased 56% to about $400 million. Gross profit rose 29% to a record $127 million. The gap between payment-volume growth and gross-profit growth reflects mix and pricing, but profit expansion remained healthy.
Merchant relationship metrics are encouraging. Net revenue retention reached 153%, its fifth straight quarter above 140%, while TPV retention was 188%. More than 760 merchants use dLocal, and management said share of wallet increased by two percentage points year over year in the first half. That suggests growth is coming not only from new clients, but also from existing merchants using more countries, payment methods and products.
Profitability is improving alongside growth. Operating profit rose 15% to $64 million, and operating profit as a percentage of gross profit reached 50%, up six percentage points sequentially. Net income increased 28% to $55 million, while adjusted free cash flow reached $69 million. Management expects automation and AI investments to support further operating leverage in the second half.
However, there are risks. dLocal operates across emerging markets, so currency swings, regulation, local economic conditions and merchant concentration can create volatility. Tougher comparisons could also moderate growth.
Even so, the growth runway appears broad. dLocal raised 2026 TPV growth guidance to 60% to 70% and gross-profit growth guidance to 25% to 30%. With low estimated market share, rising merchant penetration and expanding products, its growth case looks more diversified than Dave’s.
How Do Estimates Compare for DAVE & DLO?
The Zacks Consensus Estimate for Dave’s 2026 and 2027 sales implies year-over-year growth of 31.57% and 21.52%, respectively. The consensus mark for 2026 and 2027 EPS suggests a year-over-year increase of 28.83% and 28.65%, respectively. Over the past 30 days, estimates for DAVE’s 2026 and 2027 EPS have been revised upward.
For Dave:
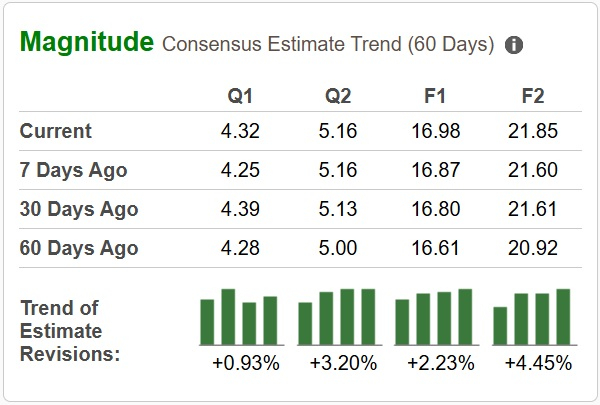
Image Source: Zacks Investment Research
The Zacks Consensus Estimate for dLocal’s 2026 and 2027 sales calls for year-over-year growth of 44.71% and 26.87%, respectively. The consensus estimates for 2026 EPS have been revised marginally upward, while those for 2027 have remained unchanged over the past 30 days. However, the figures suggest a year-over-year increase of 2.50% and 31.30%, respectively.
For dLocal:
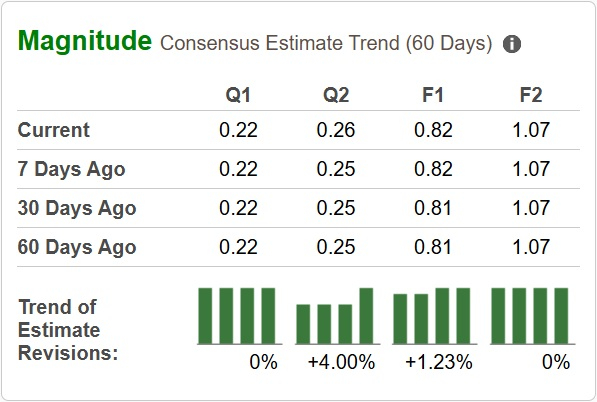
Image Source: Zacks Investment Research
Price Performance and Valuation of DAVE & DLO
In the past three months, Dave shares have surged more than 55%, while dLocal shares have climbed 25.8%. In comparison, the S&P 500 composite has advanced 1.8% in the same time frame.

Image Source: Zacks Investment Research
Following the share rally, DAVE is trading at a forward 12-month price-to-sales of 5.45X, which is above its one-year median of 4.57X. Meanwhile, DLO is presently trading at a forward 12-month price-to-sales of 2.41X, which is below its one-year median of 2.67X.
This indicates that investors already pay a large premium for Dave’s strong margin expansion and rapid U.S. consumer growth, but it also carries greater credit and regulatory exposure. dLocal pairs a comparable earnings multiple with faster payment-volume growth, wider geographic reach and strong merchant retention. On that basis, dLocal’s valuation appears easier to support now.

Image Source: Zacks Investment Research
Conclusion
Both companies are executing well, and Dave’s combination of member growth, improving credit metrics and higher profitability deserves attention. Its raised outlook also shows momentum. Still, the business remains more exposed to U.S. consumer credit conditions, regulatory issues and the performance of ExtraCash.
dLocal offers a broader growth engine built around emerging-market payments, deeper merchant relationships and increasing operating leverage. Its volume growth, retention metrics and raised guidance strengthen that case. For investors choosing between the two now, dLocal appears to offer the more attractive risk-reward profile, while Dave looks better suited to patient existing shareholders than aggressive new exposure.
DAVE currently has a Zacks Rank #3 (Hold), while dLocal carries a Zacks Rank #2 (Buy). You can see the complete list of today’s Zacks #1 Rank (Strong Buy) stocks here.
Beyond Nvidia: AI's Second Wave Is Here
The AI revolution has already minted millionaires. But the stocks everyone knows about aren't likely to keep delivering the biggest profits. AI’s second wave is moving from infrastructure to implementation and these companies are at the forefront of this transition, positioned to become what Amazon and Google were to the internet era.
See Stocks Now >>Want the latest recommendations from Zacks Investment Research? Today, you can download 7 Best Stocks for the Next 30 Days. Click to get this free report
Dave Inc. (DAVE): Free Stock Analysis Report
DLocal Limited (DLO): Free Stock Analysis Report
This article originally published on Zacks Investment Research (zacks.com).