Can LPL Financial Sustain Its Strong Asset-Gathering Momentum?
Can LPLA sustain strong asset growth and advisory momentum as moderating organic NNA and lower cash balances create uncertainty over future growth?
LPL Financial Holdings Inc. LPLA reported its July 2026 activity, showing continued growth in client assets and positive organic net new assets (NNA), despite modest sequential declines across some key metrics.
Total client assets have followed a strong multi-year growth trajectory at a CAGR of 18%. They increased significantly from 2021 through 2025 to reach a peak of $2.56 trillion at the end of the second quarter of 2026. As of July 2026, total client assets stood at $2.55 trillion, down marginally from the second-quarter peak but up 31.3% year over year. The strong annual increase was driven by robust growth in advisory assets and continued client asset inflows, extending LPL Financial's strong asset-gathering momentum.
Total Client Asset Growth

Image Source: LPL Financial Holdings Inc.
Advisory assets continued to gain share of total client assets, reaching $1.54 trillion in July 2026, or 60.6% of total assets, up 43.5% year over year, reflecting LPL's ongoing shift toward recurring, fee-based revenues. Although advisory assets edged down sequentially, strong year-over-year growth underscored continued momentum. Brokerage assets stood at around $1 trillion, down 1.2% sequentially but up 16.2% year over year, with a more uneven growth trend than advisory assets, further highlighting the favorable shift toward advisory-led revenues.
Organic NNA remained positive for every year since 2021, although the growth pace has moderated from elevated levels earlier in the decade to roughly 5.2% on a trailing 12-month basis by mid-2026. Cumulative organic NNA has surpassed $600 billion over the period. At the end of July, LPL generated $7.4 billion in organic NNA, down from $11.3 billion in June, translating into an annualized growth rate of 3.5%.
Total Organic NNA Trend

Image Source: LPL Financial Holdings Inc.
Client cash balances have remained volatile over the past five years, with their share of total client assets steadily declining as overall assets grew faster. In July, total client cash balances fell 4.6% sequentially to $54.3 billion but remained 9.7% above the year-ago level, while bank sweep balances declined 4.3% from June to $51.8 billion but rose 16.7% year over year.
Despite lower cash balances, client market activity remained healthy, with net buying activity increasing to $14.7 billion from $13.1 billion in June, indicating continued client engagement.
Our Take on LPL Financial
We believe LPL Financial's July activity remains encouraging, with strong year-over-year growth in client and advisory assets, positive organic NNA and healthy net buying activity. The continued shift toward advisory assets supports a more recurring, fee-based revenue mix. While moderating organic NNA and lower assets and cash balances indicate near-term softness, sustained advisory inflows remain favorable. Overall, LPL's asset-gathering capabilities and rising advisory penetration should support long-term growth.
Over the past six months, shares of LPL Financial have gained 16.5% compared with the industry’s 18% increase.
Six Months Price Performance
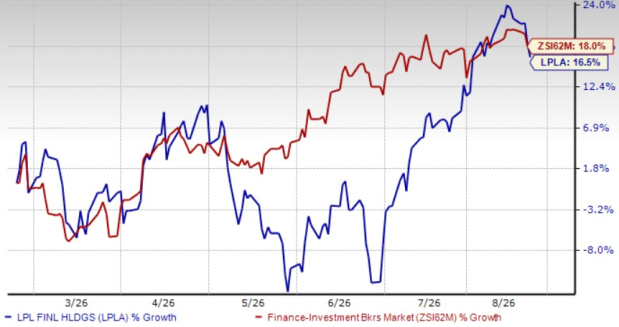
Image Source: Zacks Investment Research
LPLA’s Zacks Rank
At present, LPL Financial carries a Zacks Rank #3 (Hold). You can see the complete list of today’s Zacks #1 Rank (Strong Buy) stocks here.
Peer Firm’s July Month Update
Interactive Brokers Group’s IBKR July 2026 performance remained strong, with DARTs increasing 27% year over year to 4.4 million despite a 16% monthly decline. Client equity rose 32% to $906.7 billion, while margin loan balances jumped 49% to $100.7 billion, reflecting higher client activity and balances.
Interactive’s client accounts grew 34% year over year to 5.3 million, supporting sustained platform expansion. Credit balances increased 25% to $180.5 billion, while stocks, options, and futures recorded average commissions of $2.13, $3.42, and $3.95 per cleared order, respectively.
Charles Schwab’s SCHW July 2026 activity remained strong, with core net new assets rising 24% year over year to a July record of $58.1 billion. Total client assets reached $13.04 trillion, up 19% year over year, while 417,000 new brokerage accounts were opened during the month.
Schwab’s trading activity remained robust, with daily average trades reaching 11.6 million and margin balances rising 51% from 2025-end to $169.9 billion. Active brokerage accounts stood at 39.9 million, while transactional sweep cash declined $8.9 billion to $476.8 billion.
Beyond Nvidia: AI's Second Wave Is Here
The AI revolution has already minted millionaires. But the stocks everyone knows about aren't likely to keep delivering the biggest profits. AI’s second wave is moving from infrastructure to implementation and these companies are at the forefront of this transition, positioned to become what Amazon and Google were to the internet era.
See Stocks Now >>Want the latest recommendations from Zacks Investment Research? Today, you can download 7 Best Stocks for the Next 30 Days. Click to get this free report
LPL Financial Holdings Inc. (LPLA): Free Stock Analysis Report
The Charles Schwab Corporation (SCHW): Free Stock Analysis Report
Interactive Brokers Group, Inc. (IBKR): Free Stock Analysis Report
This article originally published on Zacks Investment Research (zacks.com).